Oil and Gas GDP: Understanding Its Role in Canada’s Economy
Analyzing how petroleum and natural gas contribute to employment, government revenue, and economic cycles
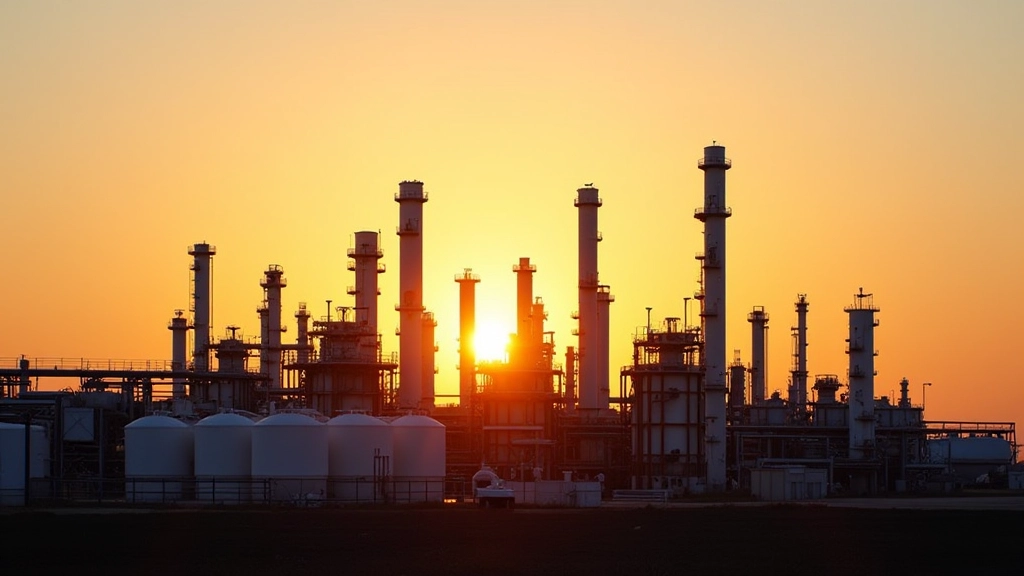
Why Oil and Gas Matters to Canada’s Economy
Canada’s relationship with oil and gas is complicated. We’re not just a resource nation—we’re a global energy producer. The energy sector contributes significantly to our gross domestic product, but it’s also tied to global market forces that we don’t always control.
Understanding how these industries work isn’t just for economists or policy makers. It affects employment in communities across the country, government budgets at every level, and even investment decisions for regular Canadians. When oil prices drop, entire provinces feel it. When energy projects expand, they create jobs that ripple through local economies.

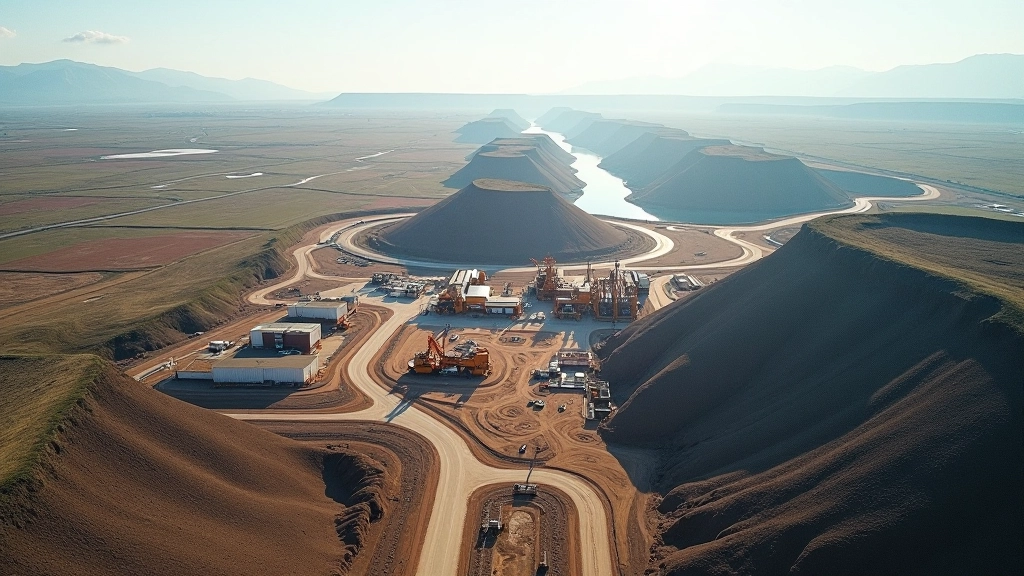
The Size of Canada’s Energy Sector
Let’s talk numbers. The oil and gas sector typically accounts for around 5-7% of Canada’s total GDP, depending on the year and global prices. In 2023, the sector generated roughly $230 billion in economic activity. That’s substantial—it’s bigger than the entire mining industry and comparable to our agriculture and food sector combined.
But here’s what makes it different. Agriculture and mining are spread across the country. Energy production is concentrated. Alberta produces about 80% of Canada’s oil and almost all our natural gas. This concentration creates regional economic dependency that you’ll see reflected in provincial budgets and employment patterns.

Jobs and Employment Impact
The energy sector employs roughly 180,000 Canadians directly. These aren’t just field workers—they’re engineers, geologists, environmental specialists, equipment operators, and logistics coordinators. The average wage in oil and gas is around $110,000 annually, well above the national average of $56,000.
But employment in the sector is volatile. When crude prices fell from $110 per barrel in 2014 to $30 in 2016, Alberta lost about 37,000 jobs in energy-related sectors. That’s the reality of working in commodities—your job security is tied to global market conditions you can’t control. A decision made by OPEC or a geopolitical event halfway around the world can affect whether a rig operates or sits idle.
There’s also significant indirect employment. Construction companies building pipelines, manufacturing firms producing equipment, and service providers supporting operations create additional jobs. Some estimates suggest 2-3 indirect jobs for every direct energy sector job.
Government Revenue and Fiscal Dependency
Energy companies pay royalties to provincial governments, corporate income taxes, and property taxes. When you add it all up, oil and gas generates roughly $30-40 billion in government revenue annually. In Alberta, that’s about 30% of provincial revenue in a high-price year.
This creates a real problem for government budgeting. You can’t count on the same revenue every year. When oil prices spike, governments get windfalls and sometimes spend as if prices will stay high forever. Then when prices crash, they face sudden budget shortfalls. This pattern has happened repeatedly—1980s, 2000s, 2014-2016, and into 2020.
The Commodity Cycle Pattern
- Rising demand and prices increased investment and hiring
- Peak prices boom conditions, government spending increases
- Supply increases or demand weakens prices fall
- Lower prices project delays, job losses, budget cuts

Understanding Price Volatility and Economic Cycles
Energy prices don’t move slowly—they swing dramatically and quickly
Supply Shocks
A hurricane closes Gulf of Mexico production. A conflict disrupts Middle Eastern exports. Production in a major field declines unexpectedly. Any of these can push prices up 20-30% in weeks.
Demand Shifts
Economic slowdown in China reduces oil consumption. A warmer winter means less heating fuel demand. Electric vehicles gain market share faster than expected. Demand changes create price pressure that affects producers immediately.
OPEC Decisions
OPEC nations control about 30% of global production. When they decide to increase or cut output, prices can shift 15-25% based on expectations alone. Canada’s producers are price takers—we respond to these decisions.
Currency Effects
Oil prices are set globally in US dollars. When the Canadian dollar weakens against the US dollar, Canadian producers get more revenue even if global prices stay the same. Currency swings create hidden economic effects most people don’t notice.
The Evolving Role of Oil and Gas in Canada’s Future
Here’s where it gets complicated. Energy demand globally will likely remain strong for decades—even with renewable growth, oil and gas are projected to provide 50%+ of global energy through 2050. Canada’s resources are needed. But transition is happening.
Governments are implementing carbon pricing, methane regulations, and emissions targets. These aren’t temporary—they’re structural changes to how the industry operates. Some projects that were profitable at $80 oil become uneconomical at $50 if you factor in compliance costs. This doesn’t mean the industry disappears, but it does mean growth will be slower and more selective than in previous decades.
The sector will remain important to Canada’s economy. But relying on it as heavily as some provinces do creates long-term vulnerability. Diversification matters. Economic resilience comes from not depending on any single commodity.

Key Takeaways
Significant but Concentrated
Oil and gas contributes 5-7% of Canada’s GDP with ~230 billion in economic activity. The benefits are heavily concentrated in Alberta and downstream suppliers.
Volatile Employment
The sector directly employs ~180,000 Canadians at high wages, but employment swings sharply with commodity prices. The 2014-2016 price collapse eliminated 37,000 jobs in Alberta alone.
Government Revenue Dependency
Energy generates $30-40 billion in government revenue annually. In Alberta, this represents ~30% of provincial revenue in high-price years—creating dangerous budget volatility.
Structural Transition Underway
Carbon pricing, emissions regulations, and global energy transition aren’t temporary—they’re reshaping how the sector operates. Future growth will be slower but the sector remains globally needed.
Want to Learn More?
Understanding resource economics helps you see how global markets affect Canadian communities and government budgets. Explore related articles to dive deeper into commodity cycles and energy policy.


Disclaimer
This article is for educational and informational purposes only. It provides an overview of how oil and gas contribute to Canada’s economy, employment, and government revenue. The data, statistics, and trends discussed are based on publicly available information as of February 2026.
Economic conditions, commodity prices, and government policies change continuously. This information shouldn’t be used as a basis for investment decisions or business planning without consulting current data and professional advisors. For specific financial, investment, or policy questions, please consult with qualified professionals who can assess your individual circumstances.